Some are winning - some are not
which US States and territories do best in beating covid-19?
Covid-19 US Map: Daily New Cases and Deaths by State
Click on a state to see new cases, new deaths, or current hospitalizations.
Data Source: NYT, The COVID Tracking Project
Created by: Era Iyer, Tufts University
States and Territories that are nearly there
States and Territories that need to take action
Actions to win
Act Quickly
Don’t wait for “more data” or results from complicated models. It isn’t too late to start now. The earlier you act, the earlier things can go back to normal.
Isolate away from home
Set up facilities to isolate infected individuals from their family members. Roughly 80% of transmission in Wuhan was within the home.
Strict travel restrictions
If you are in a green zone with little to no community transmission, impose travel restrictions and reopen the local economy. For red zones, restrict outward travel to avoid infecting others. For essential travel, have mandatory quarantines to avoid spreading the virus.
Massive amount of testing
Testing allows you to identify infected individuals and separate them from the rest of the community.
clean air for everyone
Reducing transmission by having everyone wear a face mask is simple, cheap, and highly effective.
Improving ventilation of indoor spaces is also vital for reducing transmission.
Continue practicing social distancing
Stay away from crowded areas and keep as much distance between nearest neighbors as possible. Those with comorbidities (the elderly, overweight, immunocompromised, etc.) should be the last to be reintroduced into society, as they are the most vulnerable.
Be patient. Don’t reopen too early
Reopening too early runs the risk of triggering exponential growth again. This might erase all of the benefits gained from the lockdown so far. It could increase the total amount of deaths, overwhelm the medical system, and create a scenario where another lockdown is necessary.
IMPLEMENT CONTACT TRACING
Hiring contact tracers and adopting digital contact tracing technologies will save lives, create jobs, and allow for an earlier return to normalcy.
Frequently asked questions
WHAT ARE THE CLASSIFICATION CRITERIA?
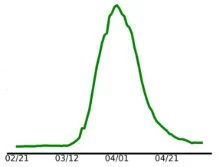
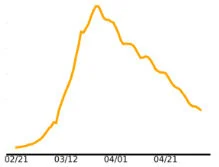
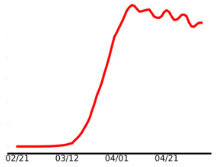
In order to completely contain the virus, new cases per day must go to zero. Green countries are either at that point or very close to it. Yellow countries are those which could reach that point within a reasonable time frame. They still have to get lower to be green. Red countries are either going the wrong way, staying constant, or going down very slowly.
While some yellow curves might look similar to green curves, comparing the total numbers of new cases per day will often explain the differences in classification.
WHY NOT SHOW CASES PER CAPITA?
Cases per capita is an important metric. However, when it comes to eliminating the virus, the number of new cases per day must be zero. The fraction of the population is not what matters. If a state has 100 new cases per day, that provides many routes for the virus to spread, regardless if the population is 1,000,000 or 10,000,000.
Why are all of the peaks the same height?
These plots are adjusted for each state in order to better show the data. The vertical axis is plotted in arbitrary units, in order to easily compare the shapes of the curves. As you can see from the states which have been successful in fighting COVID-19, it only takes about 5-7 weeks of strong interventions to get rid of the majority of cases. The data show that taking half-measures does not work.
Isn’t much of the confirmed case data inaccurate? Why should I trust this?
While there is some amount of uncertainty in the actual numbers, we argue that those are likely irrelevant to the question of which actions need to be taken. Let’s assume the testing is done in a way in which you only catch 10% of the cases. This would simply scale down the curves by a factor of 10, which would not change the shape of the curves. If there is a sharp increase in the amount of testing vs time, one would expect to see more confirmed cases, even if the actual number of infections is going down. Taking a rolling 7-day average helps reduce the size of the features which show up on timescales of a few days.
Different STATes have various amounts of testing. Aren’t large case counts just a result of large amounts of testing?
There are two main factors which influence the total amount of confirmed COVID-19 cases. The first is the total number of infections within the population, the second is the amount of testing being done. It is possible for highly infected regions to show a small number of confirmed cases if their testing is insufficient, which is why the positive testing rate is such an important factor.
Lockdowns hurt the economy, which in turn can cause many problems. Unemployment, psychological distress, and long-term economic harm need to be considered when deciding how to act.
This is absolutely true. There are more factors at play here than just the physical health of individuals and communities.
However, having economic interruptions which last for several weeks is a historically validated response strategy that is as old as history. A short, hard lockdown saves both the economy and the health of the population. If the lockdown is not doing the job very well, and new cases will not slow down, the strategy would be to strengthen the lockdown, rather than lift it.
The price a country pays for reopening too early can be incredibly high. Massive amounts of deaths, a collapsed healthcare system, and having multiple lockdowns would cause massive amounts of damage, and must be avoided.


